
![DevOps-9: Continuous Monitoring [Nagios]](http://www.techntuts.com/public/default-image/default-730x400.png)
DevOps-9: Continuous Monitoring [Nagios]
DevOps Tutorial Outline:-
- DevOps-1: Introduction to DevOps
- DevOps-2: Learn about Linux
- DevOps-3: Version Control System [Git]
- DevOps-4: Source Code Management (SCM) [Github]
- DevOps-5: CI/CD [Jenkins]
- DevOps-6: Software and Automation Testing Framework [Selenium]
- DevOps-7: Configuration Management [Ansible]
- DevOps-8: Containerization [Docker]
- DevOps-9: Continuous Monitoring [Nagios]
- DevOps-10: Continuous Orchestration [Kubernetes]
DevOps-9: Continuous Monitoring [Nagios] - Outline
- 9.1: Learning Objectives
- 9.2: Overview of Continuous Monitoring
- 9.3: Nagios Overview
- 9.4: Nagios Plugins
- 9.5: Monitoring with Nagios
- 9.6: ELK Stack Overview
- 9.7: Demo - Monitoring Using ELK Stack
9.1. Learning Objectives
The organization is working on a project which contains the concept of Continuous Monitoring.
Objective:
- Overview of Continuous Monitoring
- Purpose of Nagios and Nagios Plugins
- Monitoring Tools
2.2. Overview of Continuous Monitoring
Continuous Monitoring is the ability to detect risk, compliance, and security issues in an operational environment. It acts as an auditing tool, where it can navigate through old monitoring data to analyze and improve the performance of the system.
The roles of Continuous Monitoring are:
- Assists in the design of a reliable system
- Displays application behavior during peak business hours
- Reduces cost by acquiring precise knowledge of software asset duplication
- Reduces the chance of an application going down
- Notifies you if there is a problem with your application service
- Retrieves and analyzes historical data
Types of Continuous Monitoring,
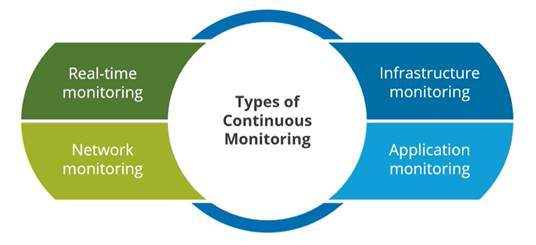
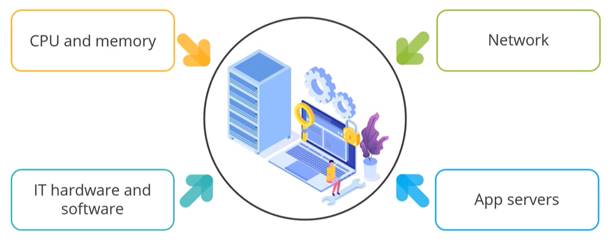
The deals with the monitoring of:


There are several tools available for Continuous Monitoring,

9.3. Nagios Overview
Nagios is an open-source continuous monitoring program for system, network and IT infrastructure monitoring. It is available in two variants,

Nagios Core is an open-source product, whereas Nagios XI is a licensed version.
Advantages of Nagios:
- Finds any type of network issue
- Monitors the infrastructure actively
- Facilitates automatic problem resolution
- Troubleshoots server performance issues
Features of Nagios:
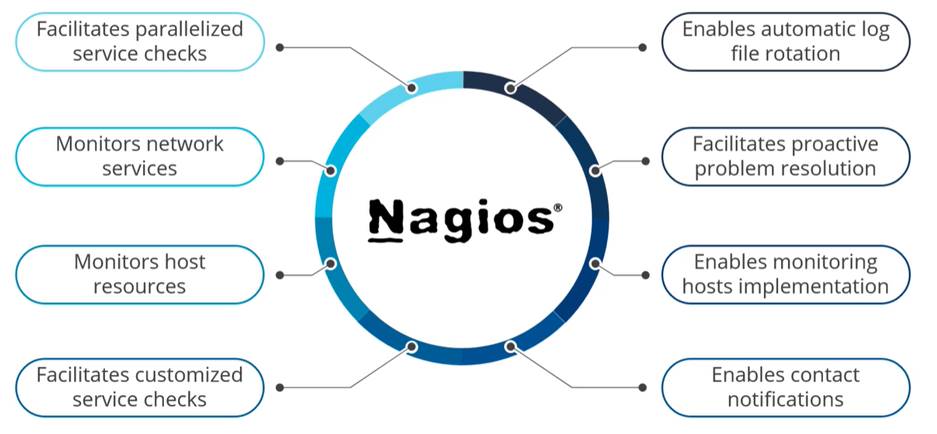
Nagios Architecture: It uses a client-server architecture.


The scheduler sends a signal to execute the plugins at the remote host. The plugin gets the status from the remote host. The scheduler updates the user interface and notification are sent to the admin.
9.4. Nagios Plugins
Plugins are compiled executable or scripts(perl/shell) that can be run from the command line. Plugins allow the user to monitor database. They are standalone extensions to Nagios Core.

- Official Plugins: These plugins are developed by the official Nagios Plugins team.
- Community Plugins: These plugins are developed by hundreds of Nagios community members.
- Custom Plugins: These plugins are developed by users in order to suit their environment.
Configuration plugins on Remote Nodes:

There are the two types of installation:

9.5. Monitoring with Nagios
Nagios implements monitoring by using the default plugins. There are some default plugins available to monitor devices and services.

Default Plugins: The Nagios exchange website offers a number of additional plugins developed by users.

9.6. ELK Stack Overview
ELK stack is an open-source, distributed monitoring solution sittable for almost any structured and unstructured data source. ELK is the acronym for three open-source projects:

The main components of ELK stack are:

Elasticsearch: It is distributed search and analytics engine analytics for data. It is highly scalable.

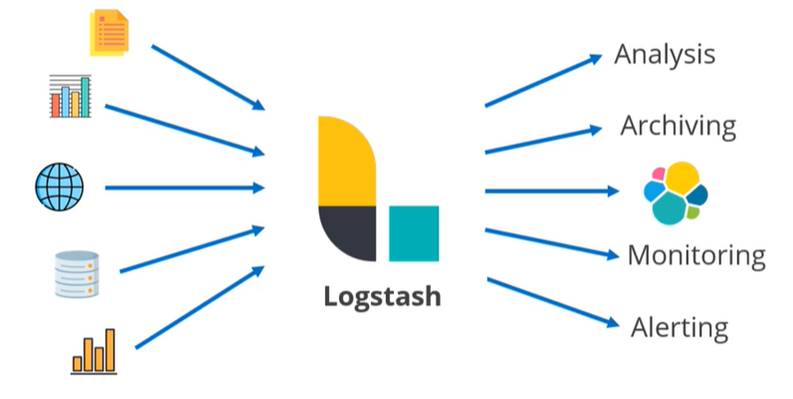
Logstash: Data processing component and it collect data from various sources.
Kibana: It is a data visualization tool. It provides the graphical user interface for Elasticsearch. It has – Ease of use, Ease of conversion, Ease of analyzing complex data.
Beats: Beats are lightweight data collectors. These are installed directly on the data source. The most frequently used data collectors are:

Benefits of ELK Stack:
- Views stats to detect defects in application
- Collects logs from servers and applications that can be analyzed for improvement
- Backup of monitoring stats and able to store our monitoring system.
- Combination of Elasticsearch, Logstash, and kibana.
- A set of utilities provide the most powerful analytics for the business.
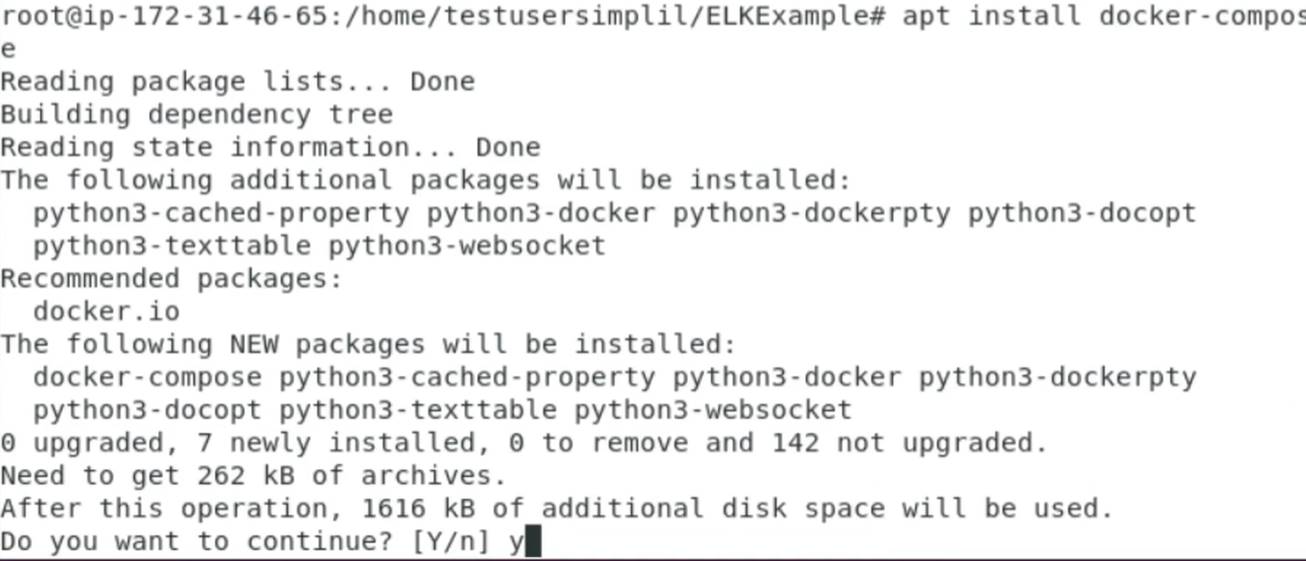
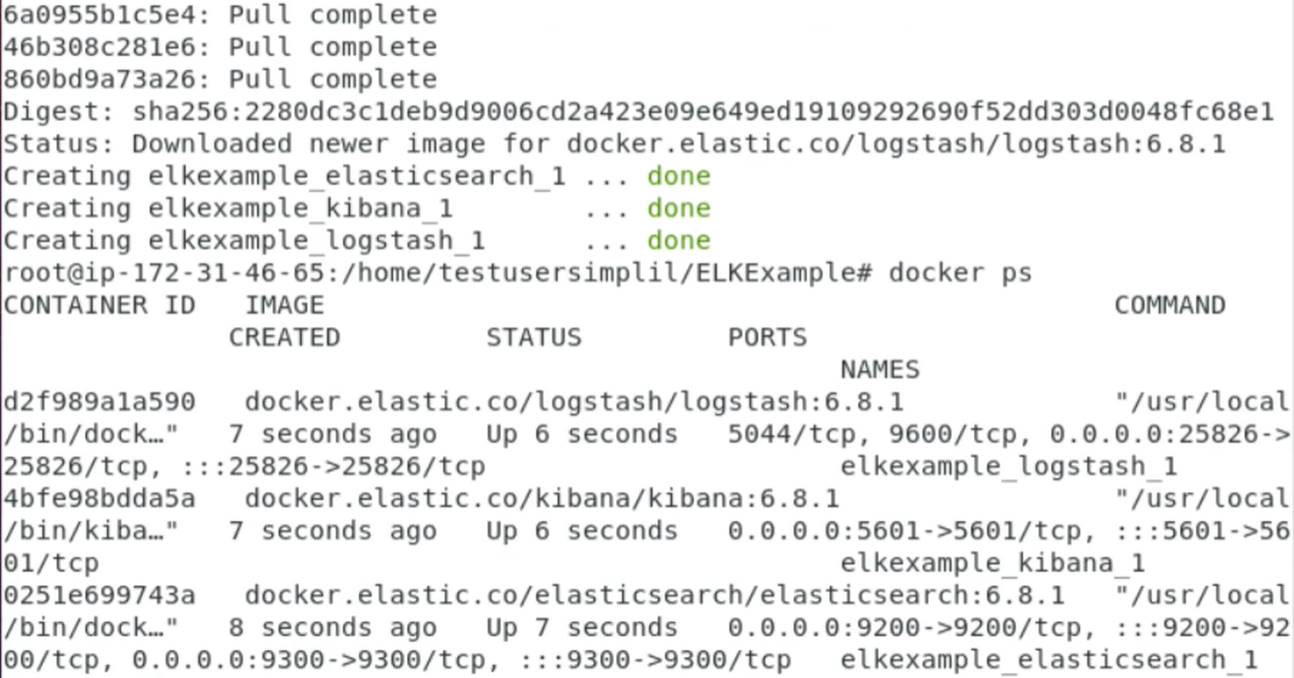
9.7. Demo - Monitoring Using ELK Stack
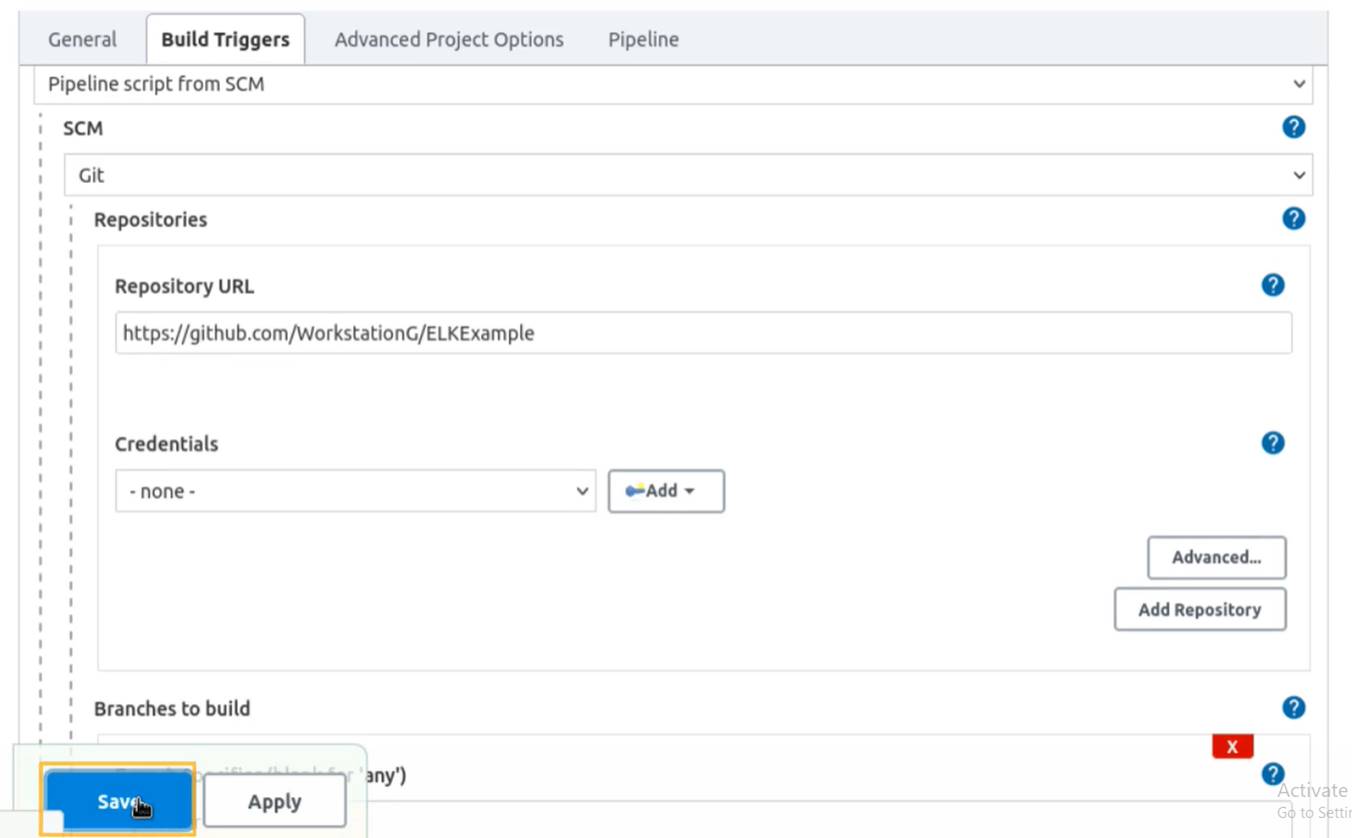
 https://github.com/WorkstationG/ELKExample

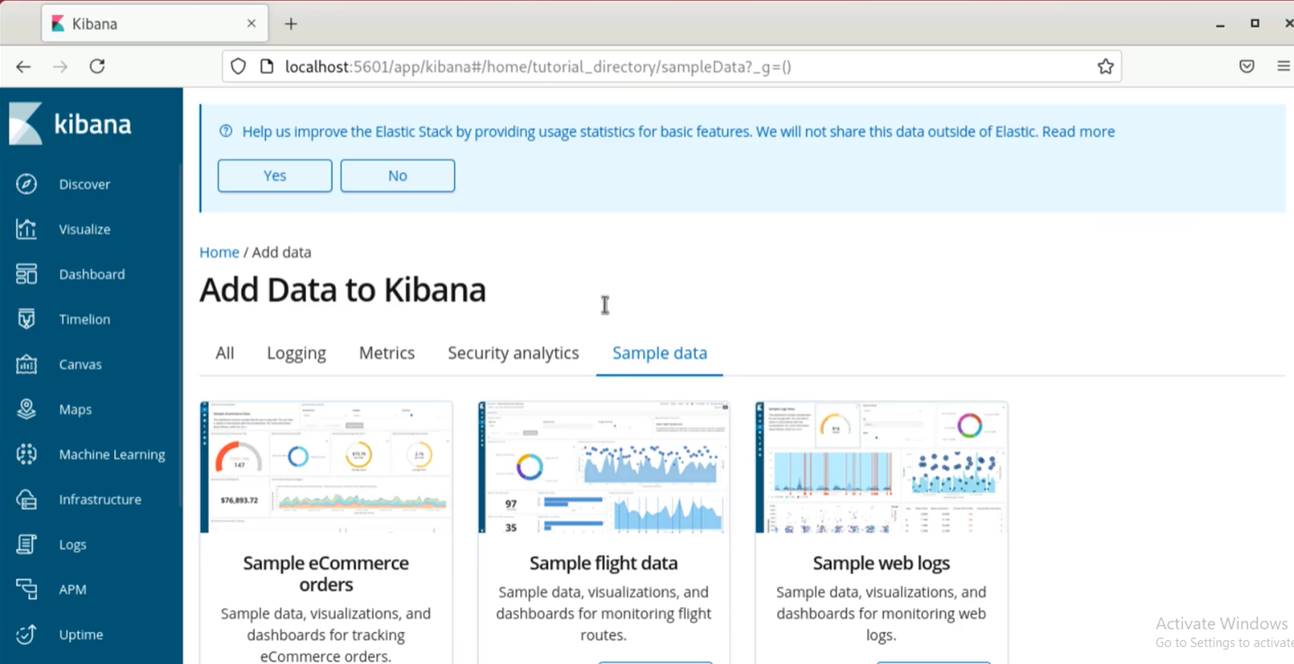
Open kibana to your web browser: http://localhost:5601/app/kibana
In your localhost login to Jenkins: http://localhost:8080/login
Dashborad>Credentials>System>Add Global credential from Jenkins,

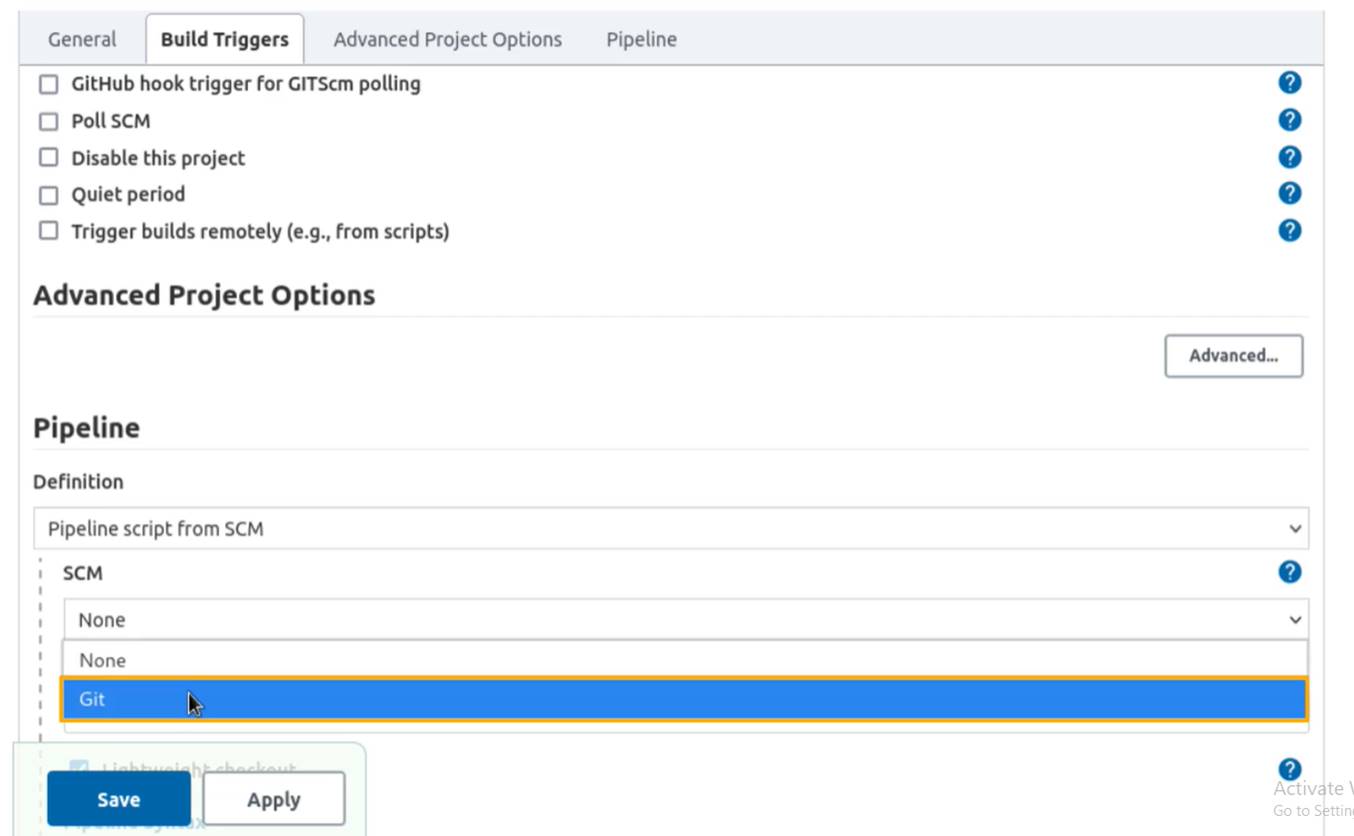
Create an “pipeline” item,


In the command line,

Now go back to the jenkin item “SpringBootApplicationDocker” and click on “build now” to build the Jenkins job and to deploy the Docker container on the Docker host.
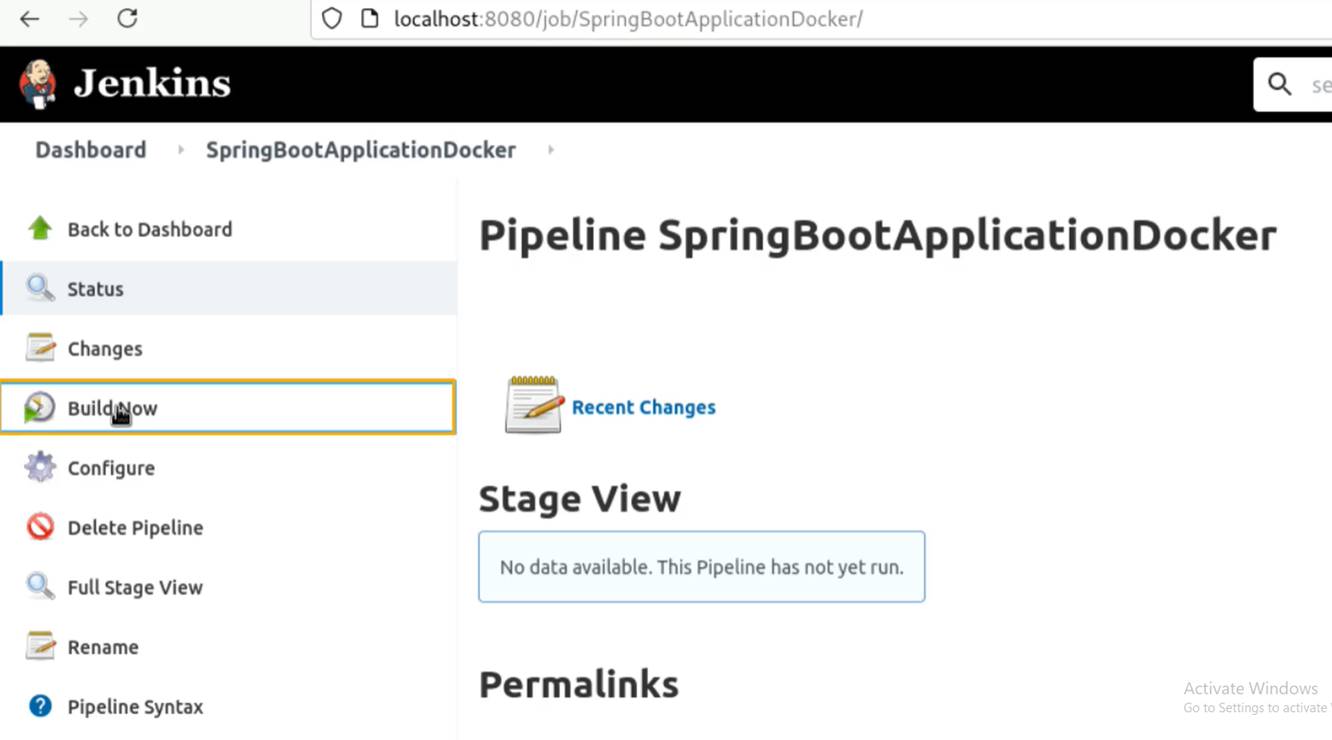
You can see that Jenkins pipeline has completed the build and the deployment process for the SprintBootApplicationDocker.


Now go back to your terminal,

Now navigate to your web browser and explore different page for your Spring boot application,

Now go to the kibana dashboard, Management>Index Management –to the log result for your application,

In this way we can perform the monitoring by ELK Stack.

